State Transitions
Track when the discrete values of topic message paths, specified using message path syntax, change.
When playing back a pre-recorded data source (e.g. a local or remote .bag file), this panel will preload the data belonging to the specified topic message paths for the whole playback timeline.
Current playback time will be indicated by a vertical gray bar.
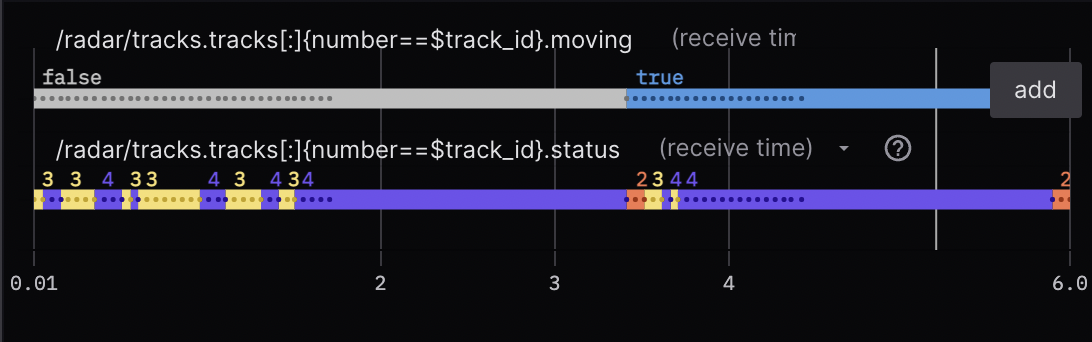
Paths can point to any primitive value (numbers, booleans, enums, etc.), but will be most useful for enums.
Note: Constants included in your ROS message definition will be displayed as a label for each "enum" plot. Limit enums to one per message definition, as Foxglove will not know which constant name to use in the event of multiple matches.
Settings
General
| field | description |
|---|---|
| Sync with other plots | Sync zooming and panning with other plots in the layout |
| Show points | Display a point for every incoming message |
X Axis
| field | description |
|---|---|
| Min | Minimum x-axis value |
| Max | Maximum x-axis value |
| Range (seconds) | Width of the panel viewport as it follows playback (in seconds) |
Series
| field | description |
|---|---|
| Message path | Message path containing values for the series |
| Label | Label displayed in the legend for the series |
| Timestamp | Timestamp used for message ordering (Receive Time or Header Stamp) |
User interactions
Scroll to zoom, and drag to pan. Double-click to reset the view.
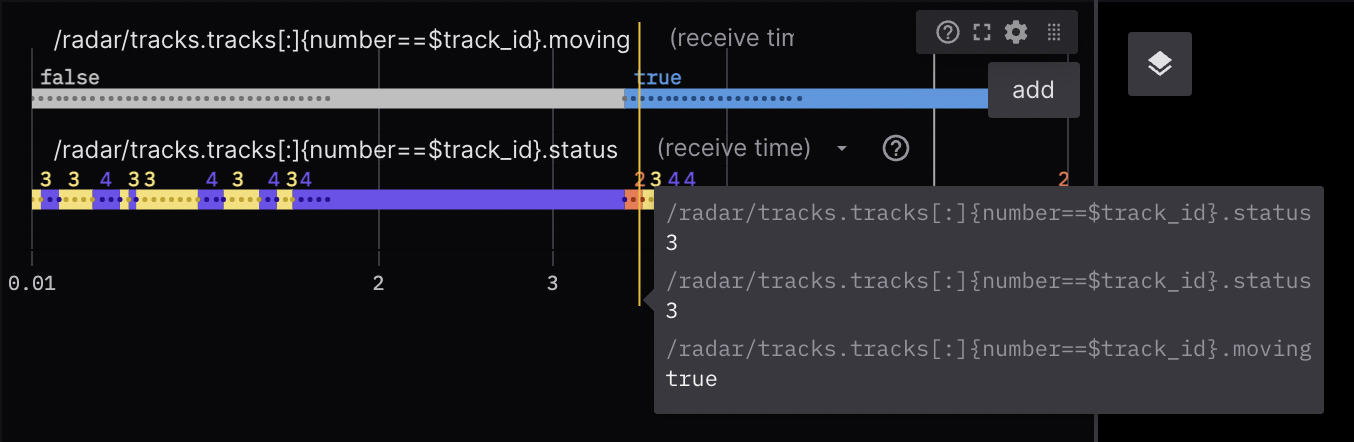
Hover over any point on a chart to see its details in a tooltip. You'll see a vertical yellow bar appear, as well as a corresponding yellow marker on the playback timeline. Clicking will seek playback to the yellow marker on the timeline.
Hover over topic message paths to edit or delete them.