Diagnostics (ROS)
Display the status of seen nodes (i.e. stale, error, warn, or OK) from ROS DiagnosticArray topic messages in a feed. Drill down into data for a given diagnostic name and hardware ID (e.g.diagnostic_name/hardware_id).
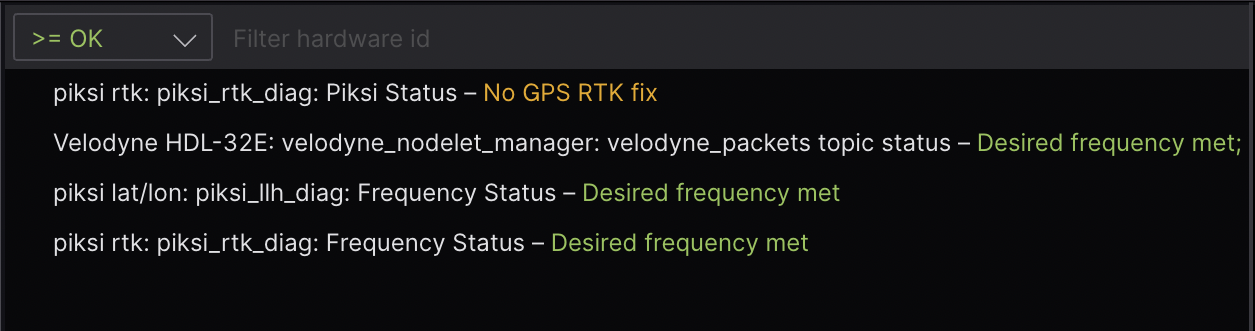
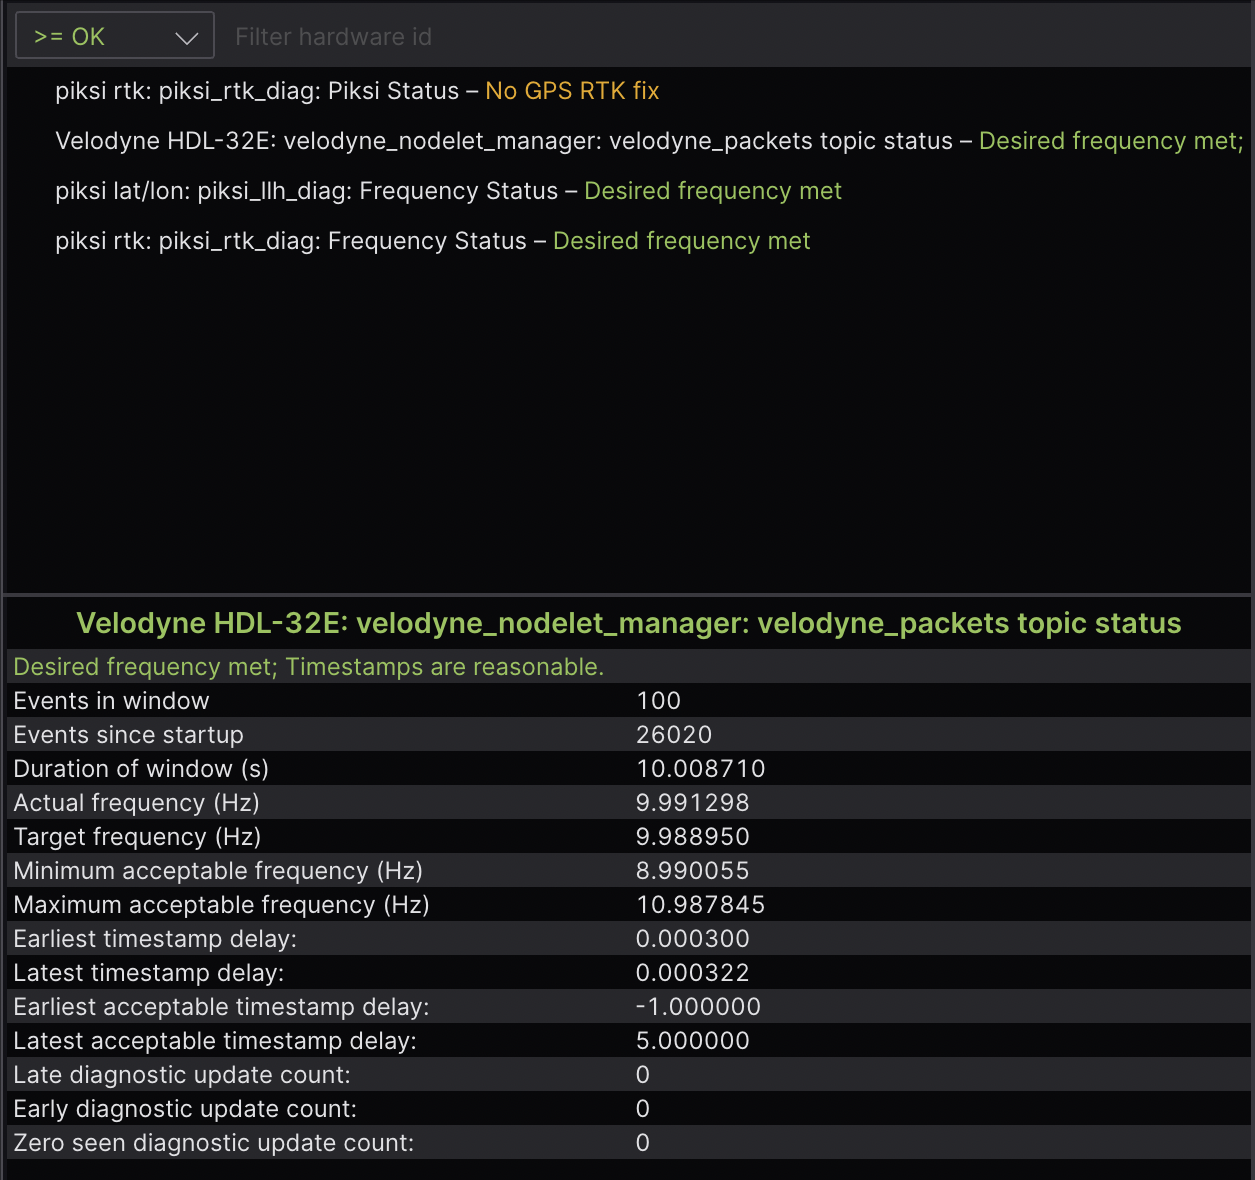
Open a Diagnostics – Summary (ROS) panel to see the status of seen nodes (i.e. stale, error, warn, or OK) in a live feed.
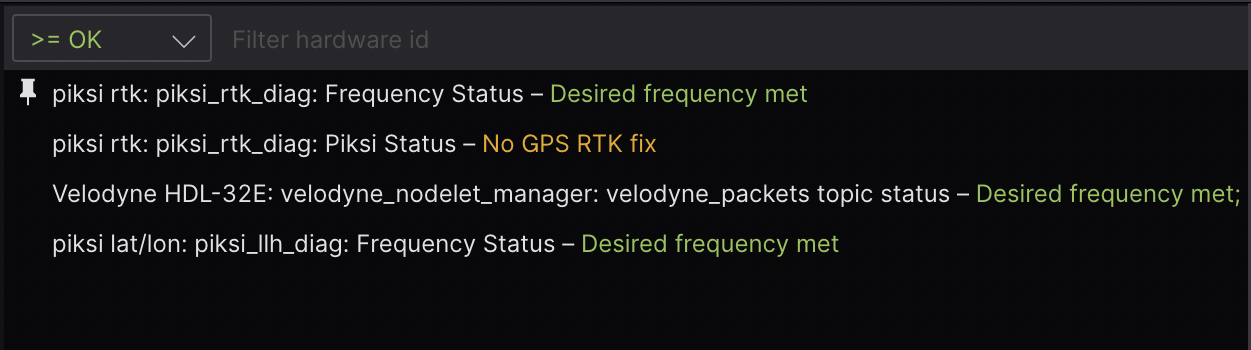
To pin a node to the top of your feed, hover on an entry and click the pin icon that appears.
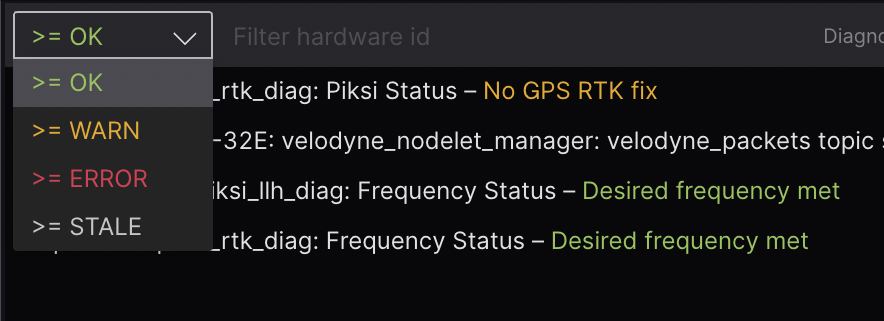
Use the dropdown menu to select the minimum level by which you want to filter your diagnostics.
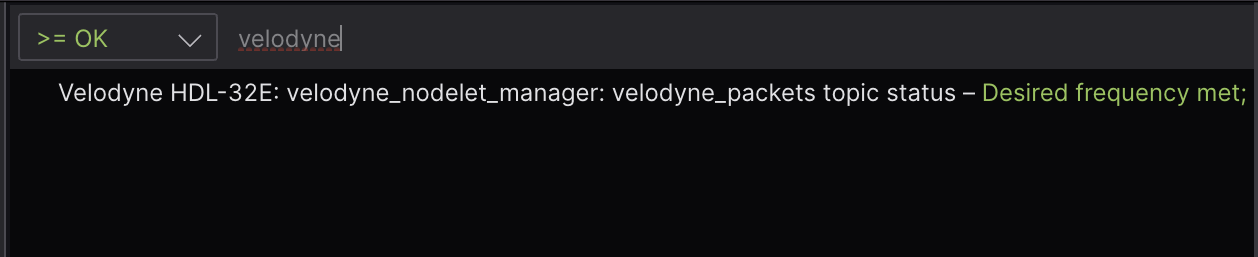
Use the search field to fuzzy filter entries by hardware_id and node name. Results will be ordered by how early the search text appears in the matched label.
Click any entry to open a corresponding Diagnostics – Detail (ROS) panel with the clicked node’s relevant details. Alternatively, you can manually open a new Diagnostics – Detail (ROS) panel and input a diagnostic to inspect. The displayed keys and values support rich formatting with basic HTML tags – e.g. <b>, <u>, <table>, etc.
Supported messages
To use this panel, your data source must provide messages conforming to one of the following supported schemas.
DiagnosticArray
| framework | schema |
|---|---|
| ROS 1 | diagnostic_msgs/DiagnosticArray |
| ROS 2 | diagnostic_msgs/msg/DiagnosticArray |
Settings
Diagnostics – Summary (ROS)
General
| field | description |
|---|---|
| Topic | ROS DiagnosticArray topic to subscribe to for nodes |
| Sort by level | Toggle whether you want to sort seen nodes by level |
Diagnostics – Detail (ROS)
General
| field | description |
|---|---|
| Topic | ROS DiagnosticArray topic to subscribe to for nodes |
| Numeric precision | Number of digits to the right of the decimal point for displayed values |